NGCUSD
US natural gas futures showed recovery due to the decline in stocks, production disruptions, and the strong global demand. While a relatively calm trend was observed during the Asian session, it is important to monitor the course of European stocks. In equity markets influenced by the agendas of China and the US, factors such as the increasing trade restrictions during the Trump administration and low inflation in China heighten risk aversion tendencies. As the sell-off in the US bond market calms, expectations for a Fed rate cut seem to be postponed to the second half of the year.
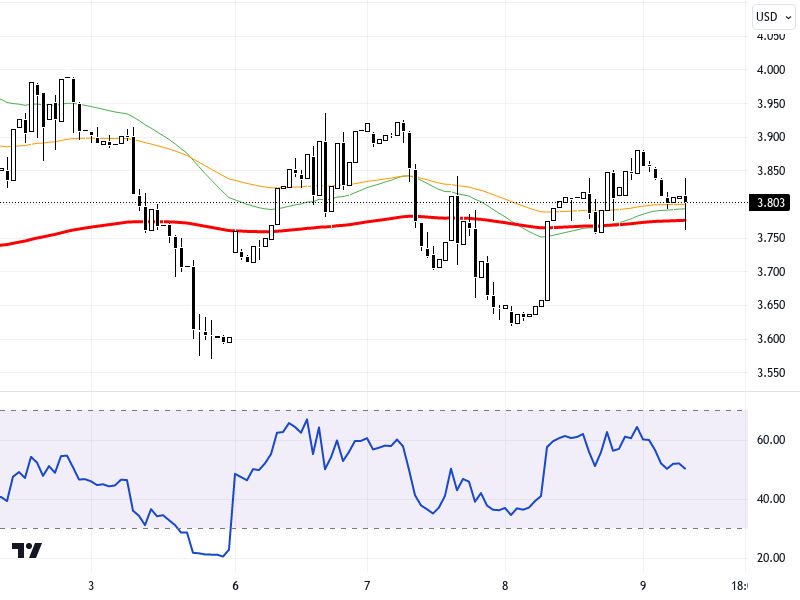
The NGCUSD pair maintains an upward outlook by staying above the 3.570 - 3.520 support levels. In upwards movements on the chart, the 3.670 and 3.740 resistance levels are significant. In the event of a downward movement, the 3.570 - 3.520 support levels should be closely monitored. Breaking through the mentioned support levels may cause the price to retreat to the 3.470 and 3.430 levels. The RSI indicator is at 52 and displays a neutral outlook. The pair has decreased by 1.37% compared to the previous day.
Support :
Resistance :