XAUUSD
Gold is showing signs of recovery as the Dollar Index declines in the US. The Fed's monetary policy statement, which remains a focal point for the markets, along with ongoing global economic uncertainties, continue to impact the precious metal. The Fed's cautious stance and the financial results of major US tech firms could increase volatility in the markets. In this context, the movements in US 10-year bond yields and inflation pressures are among the factors supporting gold.
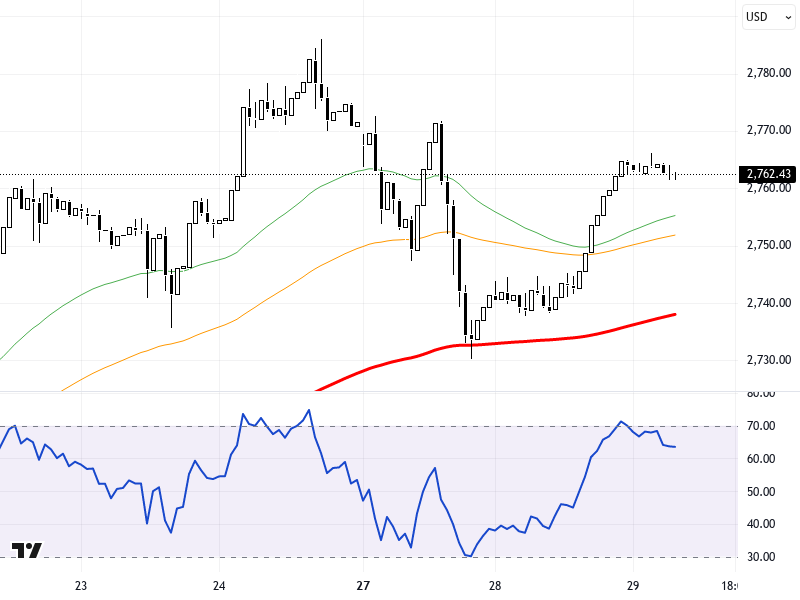
As seen in the chart, gold is trading above the 2750-2760 support zone, and as long as it holds above these levels, the upward potential is expected to continue. In upward movements, the resistance levels of 2770 and 2780 should be monitored. Although the current state of the RSI indicator is not specified in the chart, it is noteworthy that the price shows a slight decrease of -0.03%. For a downward scenario, persistent pricing below the 2750-2760 support zone is required, in which case the levels of 2736 and 2727 could be tested.
Support :
Resistance :