BRNUSD
Oil prices are tracing a downward trend in line with negative expectations regarding global demand. The U.S. Energy Information Administration's forecasts that global oil supply will exceed demand have been influential in this decline. The American Petroleum Institute's stock data showed a smaller decrease than expected, supporting the negative sentiment in the markets. In the upcoming period, U.S. CPI data and stock figures to be announced by the Energy Information Administration can be closely monitored.
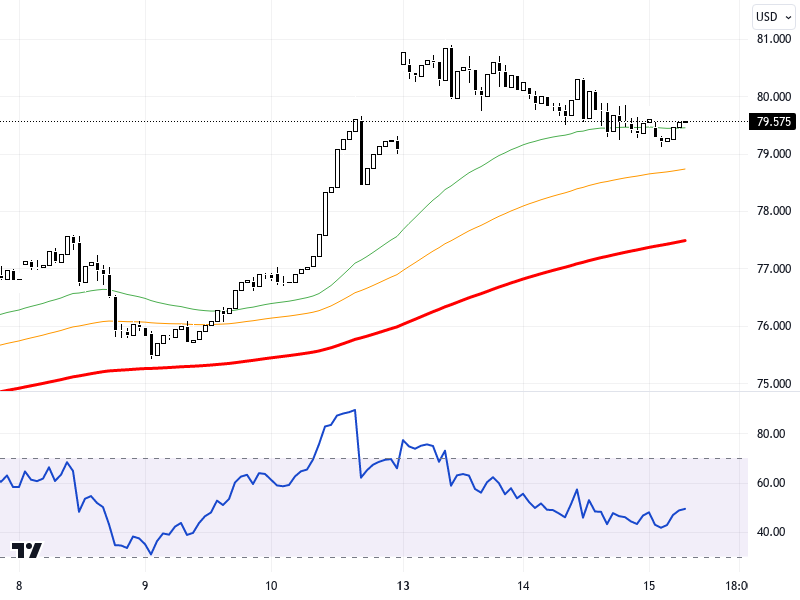
From a technical analysis perspective, the BRN/USD pair is moving between the support levels of 79.50 and 79.00 and resistance levels of 80.50, 81.00, and 81.50 on the daily chart. The pair is currently at the level of 79.575, showing a slight pullback. The RSI indicator is at 45, indicating a mildly negative market trend. There was a 0.04% decrease compared to the previous day. As long as prices remain below the 80.00 – 80.50 resistance, the downward outlook is likely to continue.
Support :
Resistance :