NGCUSD
The NGCUSD pair is subject to profit-taking following a rise driven by cold weather forecasts in US natural gas futures. This situation is causing the pair to consolidate around the 34-period exponential moving average during the Asian session. The movements in European and US stock markets throughout the day may influence pricing. Additionally, the December inflation data to be announced in the US is expected to affect Fed expectations. This data could provide new direction to the markets regarding the Fed's interest rate policy.
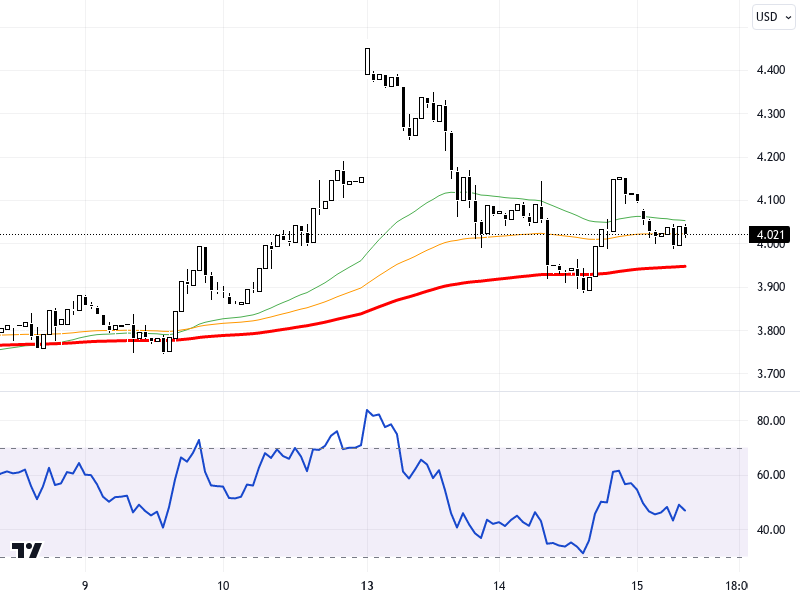
The chart analysis of the NGCUSD pair indicates that the 3.860 – 3.960 range represents a significant consolidation area on the hourly time frame. The price is positioned near the 3.96 resistance level, and hourly closings above this level may trigger a move towards the 4.02 and 4.09 levels. Conversely, pricing below the 3.86 support could initiate a pullback towards the 3.80 and 3.74 levels. The RSI indicator is showing a neutral trend at the 50 level. There has been a decrease of approximately 1.93% compared to the previous day.
Support :
Resistance :