BRNUSD
Oil futures continue their downward trend following a report from the American Petroleum Institute indicating a 1 million barrel increase in stocks. Uncertainties surrounding Trump policies and fluctuations in global markets are also supporting this decline. Particularly, stock figures to be announced by the U.S. Energy Information Administration and the trajectory of European and U.S. stock exchanges could influence pricing. Measures taken by China in Asian markets and the anticipated interest rate decision by the Bank of Japan could also have a global impact.
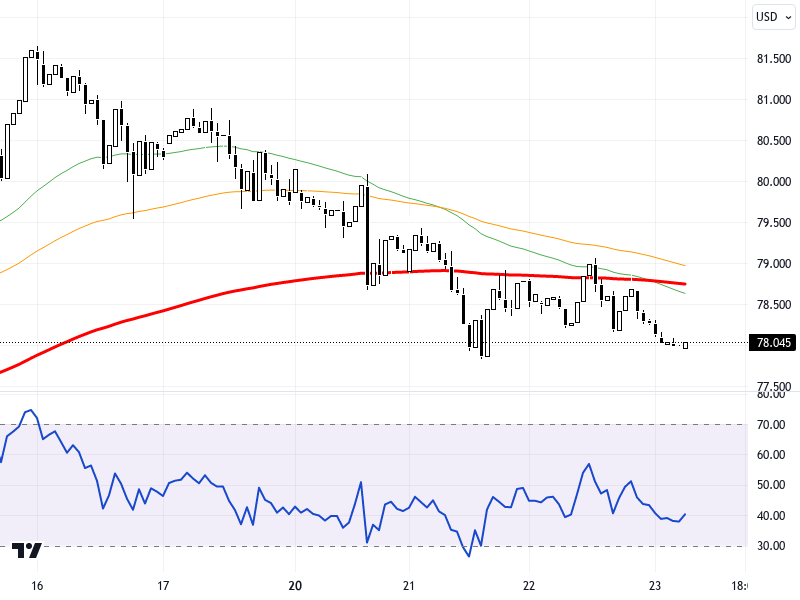
On the chart, oil prices are trading at 78.045 levels in the daily time frame. In downward movements, support levels at 78.5, 78, and 77.5 can be monitored. In the event of a possible upward recovery, resistance levels at 79, 79.5, and 80 should be tracked. The RSI indicator is at 42, displaying a negative outlook. A decline of 0.12% compared to the previous day is observed. It is suggested that the continuation of the downward trend requires the 79.50 resistance not to be breached; otherwise, the 80 level could be tested.
Support :
Resistance :