NGCUSD
US natural gas futures showed a rebound due to expectations of a stock decrease as one of the coldest days in recent years is experienced, but there are factors that may affect the persistence of this situation. In particular, mild weather forecasts for the end of January and February may suppress heating demand. Additionally, the trends in European and US stock markets and the inventory figures to be announced by the US Energy Information Administration may also impact pricing. The positive trend in Asian indices and China's market-supportive statements are also increasing optimism in international markets.
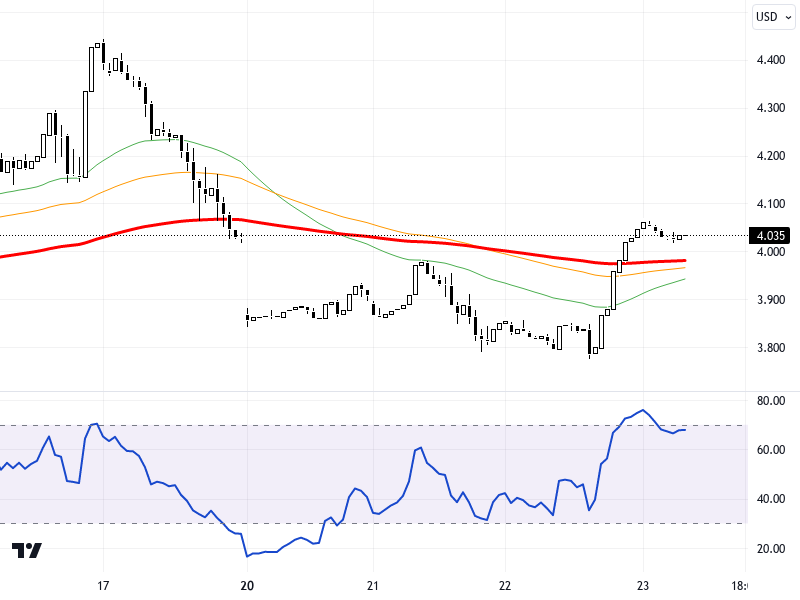
When examining the hourly chart of the NGCUSD pair, the upward trend may continue as long as it remains above the 3.415 – 3.470 support zone. In upward movements, the levels of 3.52 and 3.57 may be observed as resistance points. In the event of possible declines, if it falls below the 3.415 level, the levels of 3.36 and 3.295 can be monitored as support. The RSI indicator is at the 48 level and shows a neutral tendency. The pair has experienced a 0.66% decrease compared to the previous day. These data indicate that movements between the support and resistance levels should be closely monitored.
Support :
Resistance :