NGCUSD
The NGCUSD pair remains under pressure due to the impact of U.S. natural gas futures and February weather forecasts. As the developments in European and U.S. stock markets are closely monitored, global economic data and market dynamics under the Trump administration also influence pricing. Key data like PCE inflation could shape the Fed's interest rate policy, which might indirectly affect natural gas prices.
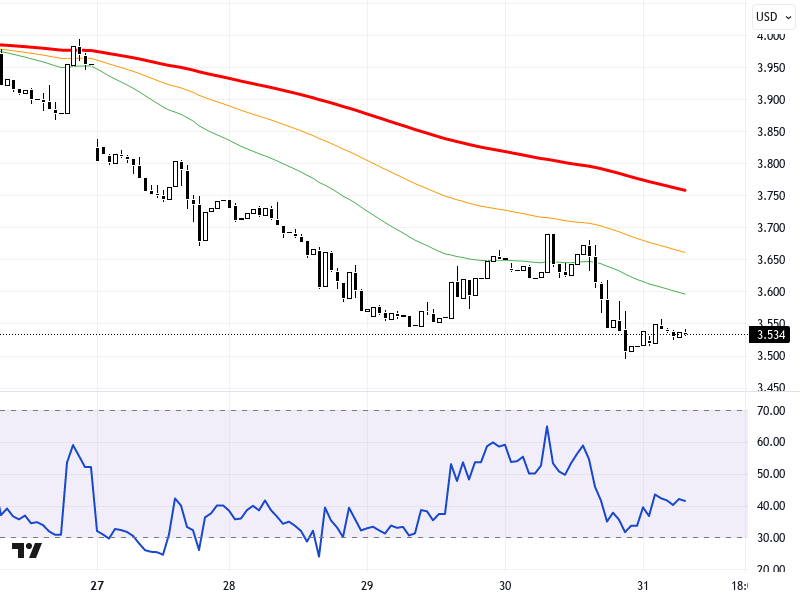
Technically, the NGCUSD pair is trading below the 3.14 resistance level on the four-hour chart. In downward movements, levels of 3.04 and 2.975 can be watched for support. In case of an upward recovery, the resistance levels of 3.14 and 3.19 may come into focus. The RSI indicator is at the 48 level, showing a neutral outlook. A 0.11% decrease is observed in the pair, indicating slight pressure in the market.
Support :
Resistance :